Also in: Português · Español · Italiano · 中文 · हिन्दी
First, the most important thing: this ranking was built from published, peer-reviewed scientific studies, giving priority to independent ones (and always flagging when a study was paid for by the manufacturer). Because it depends on published studies, the newest devices, which haven’t yet been independently tested, were left out. Validation of one generation doesn’t carry over to the next. So if your model was just released, it’s not that it’s bad: it’s that nobody has really tested it yet.
With that said: what is the most accurate wearable? It depends on what you want to measure. I combed through the 2023 to 2026 studies that compared the Oura Ring, Apple Watch, WHOOP, Garmin, Fitbit and others against the gold-standard medical tests for sleep stages, HRV, heart rate, blood oxygen saturation, step count, VO2 max and so on. Below is everything I found, organized by metric, with each study’s funding and population flagged, so you can judge the data for yourself.
The Summary: the Most Accurate by Metric
If you just want the bottom line, here it is (2026):
- Sleep stages: Apple Watch in healthy adults, independent study (κ=0.53; κ, or kappa, measures how well the device agrees with the reference test, and the closer to 1, the better). The Oura only leads in the study it paid for itself. Every device drops sharply in people with sleep complaints.
- Deep sleep: WHOOP (69.6%, independent). REM: Apple Watch (68.6%).
- Overnight HRV and resting HR: Oura Ring 4 (CCC 0.99 and 0.98).
- Daytime HR: Fitbit Charge 6 and Garmin Vivoactive 5 at the top of a ten-device test. The model matters more than the brand.
- Blood oxygen (SpO2): Apple Watch.
- Steps: Apple Watch and Garmin, both with under 5% error in the lab. Apple holds up better in daily life.
- Calories: none. Oura’s 13% daily error is the best number, and it’s still poor; Apple is close to 28%.
- VO2 max: Garmin, with about 7% error in three independent studies.
- Skin temperature: Oura (Oura’s own study).
The summary of the summary: no device wins at everything. Choose by the metric that matters most to you.
The table below brings together the findings from the peer-reviewed studies. When a value comes from a different study than the one next to it, the study is named.
| Metric | 1st place | 2nd place | 3rd place | Worst |
|---|---|---|---|---|
| Sleep stages, healthy adults (independent, Antwerp 2025) | Apple Watch S8 (κ=0.53) | Fitbit Sense (κ=0.42) | Fitbit Charge 5 (κ=0.41) | Garmin Vivosmart 4 (κ=0.21) |
| Sleep stages, healthy adults (funded by Oura, Robbins 2024) | Oura Gen 3 (κ=0.65) | Apple Watch S8 (κ=0.60) | Fitbit Sense 2 (κ=0.55) | not reported |
| Sleep stages, clinical sample (independent, Lee 2023) | Fitbit Sense 2 (κ=0.42) | Oura Gen 3 (κ=0.35) | Apple Watch S8 (κ=0.30) | not reported |
| Deep sleep (independent, healthy) | WHOOP 4.0 (69.6%) | Fitbit Sense (50.9%) | Apple Watch S8 (50.7%) | Fitbit Charge 5 (43.3%) |
| REM (independent, healthy) | Apple Watch S8 (68.6%) | WHOOP 4.0 (62.0%) | Fitbit Sense (61.3%) | Garmin Vivosmart 4 (33.1%) |
| Wake detection (independent, healthy) | Apple Watch S8 (52.2%) | Fitbit Charge 5 (42.7%) | Fitbit Sense (39.2%) | Garmin Vivosmart 4 (27.6%) |
| Total sleep time bias | Oura Gen 3 (-3 min, meta) | Fitbit Sense (+6.3 min) | Fitbit Charge 5 (+11.1 min) | Withings ScanWatch (+39.9 min) |
| Overnight HRV | Oura Ring 4 (MAPE 5.96%) | Oura Gen 3 (7.15%) | WHOOP 4.0 (8.17%) | Polar Grit X Pro (16.32%) |
| Resting HR (overnight) | Oura Ring 4 (CCC 0.98) | Oura Gen 3 (0.97) | WHOOP 4.0 (0.91) | Polar Grit X Pro (0.86) |
| Daytime HR (ten-device test, by tier) | Fitbit Charge 6 (MAPE 5.5%) | Garmin Vivoactive 5 (6.3%) | Google Pixel Watch 2 (6.7%) | Fitbit Inspire 3 (16.5%) |
| SpO2 | Apple Watch (MAE 2.2%) | Garmin Fenix (~4.5%) | Withings (~4.8%) | Garmin Venu (5.8%) |
| Steps, daily life | Apple Watch S6 (+2.1%, 3 weeks) | Garmin (10 to 18%) | Fitbit Sense (+18%) | Oura Gen 2 (50.3%) |
| Calories, daily error | Oura (13%) | Apple Watch (~28%) | not reported | not reported |
| VO2 max | Garmin (~7%, 3 studies) | Fitbit Charge 2 (~10%, retired algorithm) | Apple Watch (13 to 16%, underestimates) | not reported |
| Skin temperature | Oura (r² above 0.99 in the lab, own study) | not reported | not reported | not reported |
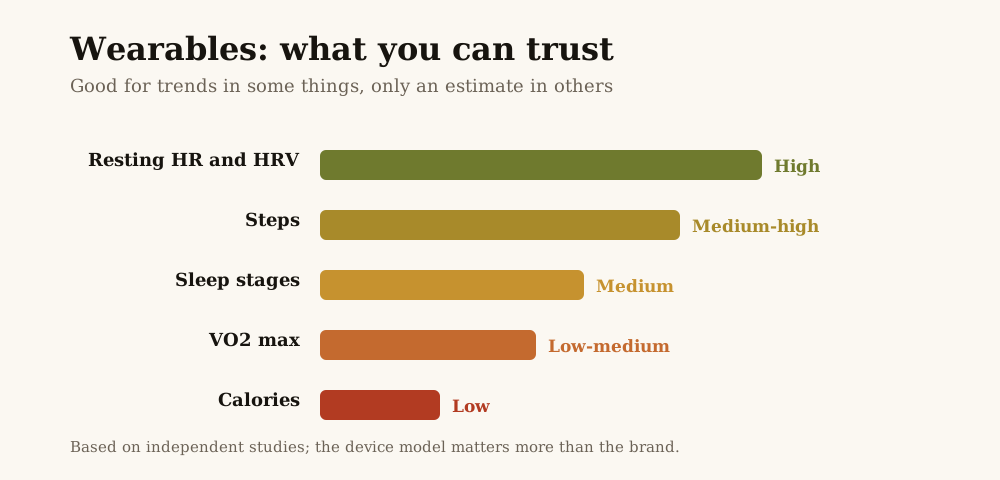
Sleep Stage Accuracy (4-stage classification)
Sleep is the most studied and most fought-over metric in the field. Four studies from 2023 to 2025 produced different rankings, and two things explain almost all of the difference: who paid for the study and whether participants were healthy sleepers or people with sleep complaints. The same device can do twice as well in the first group as in the second.
Brigham and Women’s Hospital (2024), funded by Oura, healthy adults
Robbins and colleagues compared the Oura Ring Gen 3, Fitbit Sense 2 and Apple Watch Series 8 against polysomnography (PSG) in 35 healthy adults, screened to rule out sleep disorders, over several nights.
| Device | Overall (κ) | Deep sleep sensitivity | Deep sleep bias |
|---|---|---|---|
| Oura Ring Gen 3 | 0.65 (substantial) | 79.5% | No significant bias |
| Apple Watch Series 8 | 0.60 (moderate) | 50.5% | -43 min (underestimates) |
| Fitbit Sense 2 | 0.55 (moderate) | 61.7% | -15 min (underestimates) |
Funding: this study was paid for by Oura. The lead author is a scientific advisor to Oura. The method is the same as in the independent studies (lab PSG, epoch by epoch, meaning each 30-second stretch of the test, with Cohen’s kappa); the higher number comes from selecting only people without sleep disorders, not from a methodological trick.
University of Antwerp (2025), independent, healthy adults
Schyvens and colleagues tested six wrist devices against PSG in 62 healthy adults, one night each. It was funded by VLAIO (the Flanders innovation agency), with no manufacturer money. The Oura wasn’t included, so this study can’t be used to compare rings with watches.
| Device | κ (4 stages) | TST bias | Deep sleep | REM | Wake | Note |
|---|---|---|---|---|---|---|
| Apple Watch Series 8 | 0.53 | +19.6 min | 50.7% | 68.6% | 52.2% | Best κ, best REM, best wake |
| Fitbit Sense | 0.42 | +6.3 min | 50.9% | 61.3% | 39.2% | Smallest bias |
| Fitbit Charge 5 | 0.41 | +11.1 min | 43.3% | 47.5% | 42.7% | |
| WHOOP 4.0 | 0.37 | +24.5 min | 69.6% | 62.0% | 32.5% | Best deep sleep |
| Withings ScanWatch | 0.22 | +39.9 min | not rechecked | not rechecked | 29.4% | |
| Garmin Vivosmart 4 | 0.21 | +38.4 min | 47.5% | 33.1% | 27.6% | Oldest hardware |
An important detail: all six devices mistook wake, deep sleep and REM for light sleep (a conservative approach that is common in consumer wearables), and all of them substantially underestimated time spent awake after falling asleep, by 12 to 48 minutes.
Korean multicenter study (2023), independent, clinical sample
Lee and colleagues tested 11 sleep trackers against PSG in 75 adults at 2 centers, 349,114 epochs. This was a clinical sample: everyone had a sleep complaint and the average apnea-hypopnea index was 18, meaning moderate apnea. Several authors have ties to Asleep Co. (whose app came out on top); the values below are for its competitors, so this conflict works against them, not in their favor.
| Device | κ (4 stages) | Deep sleep | REM |
|---|---|---|---|
| Fitbit Sense 2 | 0.42 | 67.1% | 68.1% |
| Oura Ring Gen 3 | 0.35 | 77.8% | 71.2% |
| Apple Watch Series 8 | 0.30 | 41.3% | 42.8% |
Notice: this isn’t disagreement with the other studies; it’s the effect of the population. Sleep fragmented by apnea is harder to stage, so every device drops: Apple goes from 0.53 (healthy) to 0.30, Oura from 0.65 (healthy, funded) to 0.35. Fitbit is the most robust across populations, at 0.42 in both settings. A separate independent study at the Charité in Berlin (Herberger, 2025) put the Oura Gen 3 at 53.2% 4-stage accuracy in 45 sleep clinic patients, compared with about 79% in Oura’s own healthy cohort.
Deep sleep, REM and total sleep time
Stage sensitivity is the share of real deep sleep or REM epochs that the device caught. No study tested every brand, so the study is named for each value. Healthy adult values come first, clinical values in brackets.
- Deep sleep: Oura Gen 3 79.5% (Robbins, funded) [77.8% clinical, Lee]. WHOOP 4.0 69.6% (Schyvens). Fitbit Sense 50.9% (Schyvens) [67.1% clinical]. Apple Watch S8 50.7% (Schyvens) [41.3% clinical]. Garmin Vivosmart 4 47.5% (Schyvens).
- REM: Oura Gen 3 76.0% (Robbins) [71.2% clinical]. Apple Watch S8 68.6% (Schyvens) [42.8% clinical]. WHOOP 4.0 62.0% (Schyvens). Fitbit Sense 61.3% (Schyvens) [68.1% clinical]. Garmin Vivosmart 4 33.1% (Schyvens).
- Total sleep time bias: Oura Gen 3 -3.0 min (Khan 2025 meta-analysis, 6 studies, N=388). Fitbit Sense +6.3, Fitbit Charge 5 +11.1, Apple Watch S8 +19.6, WHOOP 4.0 +24.5, Garmin Vivosmart 4 +38.4, Withings +39.9 (all Schyvens). Within about 30 minutes is usually considered clinically acceptable.
- Wake detection is poor across the board. Every device does well when you’re asleep (89 to 95%) and badly when you’re awake (only 27 to 52% correct), so all of them overstate how much you slept.
Overnight HRV (heart rate variability)
An Ohio State University study with the Air Force research laboratory (Dial, 2025) validated overnight HRV in 13 participants over 536 nights, using a Polar H10 ECG chest strap as the reference. No industry funding was declared.
| Device | CCC | MAPE | Rating |
|---|---|---|---|
| Oura Ring 4 | 0.99 | 5.96% ± 5.12% | Almost perfect |
| Oura Gen 3 | 0.97 | 7.15% ± 5.48% | Substantial |
| WHOOP 4.0 | 0.94 | 8.17% ± 10.49% | Moderate |
| Garmin Fenix 6 | 0.87 | 10.52% ± 8.63% | Poor |
| Polar Grit X Pro | 0.82 | 16.32% ± 24.39% | Poor |
CCC scale: 0.99 and above = almost perfect; 0.95 to 0.98 = substantial; 0.90 to 0.94 = moderate; below 0.90 = poor.
Note: the Garmin Fenix 6 is 2 generations behind current hardware, and the authors themselves acknowledged this. The sample was 13 people, albeit with 536 nights of data. The Oura Ring 5 arrived in June 2026 with a new sensor and has no validation at all yet, so the Ring 4 numbers don’t apply to it.
Resting Heart Rate
From the same Ohio State study (Dial, 2025):
| Device | CCC | MAPE | Rating |
|---|---|---|---|
| Oura Ring 4 | 0.98 | 1.94% ± 2.51% | Substantial |
| Oura Gen 3 | 0.97 | 1.67% ± 1.54% | Substantial |
| WHOOP 4.0 | 0.91 | 3.00% ± 2.15% | Moderate |
| Polar Grit X Pro | 0.86 | 2.71% ± 2.75% | Poor |
The Garmin Fenix 6 was excluded from this analysis because of a time-sync problem with the reference.
Heart Rate During the Day and During Exercise
The largest single-protocol test is the one by Gielen and colleagues (2026, KU Leuven, no conflicts): ten devices, a Zephyr reference strap, 45 participants, seated rest, a stress task, treadmill walking and intermittent walking. Only two watches were worn per session, so read it by tiers, not by exact rank.
| Tier | Device | Median MAPE | Agreement (CCC) |
|---|---|---|---|
| 1 | Fitbit Charge 6 | 5.5% | 0.93 |
| 1 | Garmin Vivoactive 5 | 6.3% | 0.83 |
| 1 | Google Pixel Watch 2 | 6.7% | 0.87 |
| 2 | Apple Watch SE | 7.3% | 0.70 |
| 2 | Garmin Vivosmart 5 | 8.1% | 0.78 |
| 3 | Polar Ignite 3 | 11.2% | 0.63 |
| 3 | Xiaomi Watch 2 | 11.9% | 0.69 |
| 3 | Polar Pacer | 13.1% | 0.66 |
| 4 | Oura Ring Gen 3 | 15.0% | 0.61 |
| 4 | Fitbit Inspire 3 | 16.5% | 0.45 |
Three things stand out. No device cleanly crosses the 5% line. The best and the worst are both Fitbits, meaning the model matters more than the brand. And the Apple device tested was the SE, the entry-level model, not a flagship.
Two other independent studies fill in the gaps. Van Oost and colleagues (2025, 12-lead ECG, 24 healthy adults, all devices at once) put the WHOOP 4.0 at 8.5% MAPE, the second worst of five; the Garmin Vivosmart 4 had the smallest error (4.4%), but discarded 49.6% of readings to get there, so the two Fitbits (Sense 2 at 5.6% and Charge 5 at 5.7%) are the honest winners of that study. Kim and colleagues (2023) ran the Apple Watch 7 and Galaxy Watch 4 against a hospital 12-lead ECG during a treadmill test in 44 cardiac patients: both had under 2% error, with the Galaxy losing agreement above 160 bpm.
The weak spot is irregular arm movement, not intensity. Steady running is one of the easiest conditions for a wrist device; badminton, soccer and rowing are the hardest. Night is easy and day is hard, which is why every manufacturer claim (WHOOP 99.7%, Oura 99%) comes from sleep data. Two free fixes with a measured effect: wear the watch three fingers above the wrist bone and tighten the strap.
Blood Oxygen (SpO2)
Warning: none of these SpO2 features is approved for medical use. They are classified as wellness features. The Garmin Venu 2s, for example, was the worst: a mean error of +5.5%, meaning it overestimates saturation (shows your oxygen as better than it really is), which is precisely the dangerous direction.
| Device | MAE | MDE | Within range | Missing data |
|---|---|---|---|---|
| Apple Watch Series 7 | 2.2% | -0.4% | 58.3% | 11% |
| Garmin Fenix 6 Pro | ~4.5% | not reported | ~44% | 28% |
| Withings ScanWatch | ~4.8% | not reported | ~38% | 31% |
| Garmin Venu 2s | 5.8% | 5.5% | 18.5% | 14% |
Step Count
The lab and real life are different tests, so I show both.
| Device | Lab/treadmill (MAPE) | Real life | Source |
|---|---|---|---|
| Apple Watch | 0.9 to 3.4% normal gait; 9.3% slow/shuffling gait (Series 5) | +2.1% over 3 weeks (Series 6, Miwa 2026); 6.4% (Series 6, Kim 2024) | Rowe 2025; Miwa 2026; Kim 2024 |
| Garmin | 4.6% (Vivoactive 4, de Leon 2026); about -15% (Fenix 6, Rider 2025) | 10 to 17.8% | de Leon 2026; Rider 2025 |
| Fitbit | 3.6% (Inspire 2, Cheung 2025) | +18.0% over 3 weeks (Sense, Miwa 2026); 17 to 35% (Charge 2) | Cheung 2025; Miwa 2026 |
| Oura Ring | No lab step data exists | 50.3% MAPE vs pedometer, +2,124 steps/day (Gen 2, Kristiansson 2023); +1,416/day vs ActiGraph (Niela-Vilén 2022) | Kristiansson 2023; Niela-Vilén 2022 |
| WHOOP | No published validation | No published validation | none |
In the lab, Apple, Garmin and Fitbit stay under 5% for normal walking. Real life separates them: Apple stays within a few percent, Fitbit counts about 18% too many, and the two studies that measured the Oura caught it counting 1,400 to 2,100 extra steps a day.
Calories (energy expenditure)
All wearables are weak at estimating calories. The cleanest multi-device number is the Stanford study (Shcherbina, 2017): across seven devices, energy expenditure error ranged from 27% to 93%, while HR on the same devices stayed under 5%. Only two devices have a daily error figure from a peer-reviewed source.
| Device | Daily energy expenditure error | Source |
|---|---|---|
| Oura Ring | 13% in real life (21.1% in the lab); underestimates, and the error grows with intensity | Kristiansson 2023 |
| Apple Watch | about 28% (meta-analysis of 56 studies); overestimates in women, underestimates in men | Choe and Kang 2025 |
| Fitbit | No daily error. Bias of 0.19 kcal/min, limits of -5.3 to +5.7 kcal/min | Chevance 2022 |
| Garmin | No daily error. Steady cardio ~6.7%, light activity 16.5% | Parak 2017 |
| WHOOP | The 18.4% figure that circulates has no primary publication | not verifiable |
The bottom line: none of them should be treated as a reliable calorie counter. Oura’s daily number beats Apple’s, but a ring has almost no movement signal when the hand is still, so it undercounts cycling, weight training and heavy effort.
VO2 Max
Method beats brand. Estimates made from an actual outdoor run have a group bias close to zero against the lab, while those made from resting HR overestimate by about 2 mL/kg/min (INTERLIVE meta-analysis, 2022). Either way, individual error is large, and accuracy gets worse in highly trained people.
| Device | MAPE | Bias | Source |
|---|---|---|---|
| Garmin Fenix 6 | 7.05% | CCC 0.73 | Carrier 2025 |
| Garmin Fenix 6 + chest strap | 6.85% | No worsening in a high-level group | Carrier 2023 |
| Garmin Forerunner 245 | 6.7% overall | 9.4 to 10.4% in highly trained vs 2.8 to 4.1% in moderately trained | Engel 2026 |
| Fitbit Charge 2 (retired algorithm) | ~10% | Small overestimate (+1.6 to +2.6 mL/kg/min) | Freeberg 2019; Klepin 2019 |
| Apple Watch Series 10 | 13.2% | -6.25 mL/kg/min, underestimates | Mayo Clinic Proc Digital Health 2026 |
| Apple Watch Series 9 / Ultra 2 | 13.3% | -6.07 mL/kg/min, underestimates | Lambe 2025 |
| Apple Watch Series 7 | 15.8% | Underestimates | Caserman 2024 |
| Polar | 13.7% | -1.0 mL/kg/min | Neudorfer 2025 |
| Samsung, WHOOP, Oura, Coros | No independent study | Manufacturer claims only | none |
Garmin is the brand with the most independent validation. Apple has three independent studies and underestimates in all of them. Fitbit showed a small overestimate, but with an algorithm Google retired in May 2026.
Skin Temperature
Oura’s internal study (2024) tested the temperature sensor in 16 people for 1 week (93,571 data points): r² above 0.99 in the lab and above 0.92 in real life, with a precision of ±0.13°C per minute.
Funding: this is Oura’s own study, not independently peer reviewed. Even so, Oura’s temperature data has already been validated in independent menstrual cycle tracking studies (Maijala, 2019). Apple, Garmin, WHOOP and Samsung also measure skin temperature, but there is little independent comparative data.
FDA-Cleared Features
Most wearable metrics are just wellness estimates. A few features have authorization from the FDA (the US regulator):
| Device | Feature | Status |
|---|---|---|
| Apple Watch (Series 4+) | ECG / atrial fibrillation detection | Cleared |
| Samsung Galaxy Watch (4+) | ECG / atrial fibrillation detection | Cleared |
| Apple Watch (Series 9+, Ultra 2) | Sleep apnea notification | Authorized |
| Samsung Galaxy Watch | Sleep apnea detection | Authorized |
| Apple Watch | Blood oxygen (SpO2) | Wellness (NOT cleared) |
| Fitbit | Irregular rhythm notification | Cleared |
Important Caveats (read before drawing conclusions)
- No device wins at everything. The best one depends on the metric that matters to you.
- Healthy vs. clinical is the biggest difference. The same device does much better in screened healthy young people than in people with sleep complaints. The Oura Gen 3 falls from κ=0.65 to 0.35; Apple from 0.53 to 0.30. Numbers from healthy cohorts don’t describe most people.
- Funding matters. The main sleep study (Robbins) was funded by Oura. The independent ones found different rankings. The funded study used the same method; the higher number comes from the selected population.
- Current hardware has barely been studied. Scientific review lags 2 to 4 years behind release. The Oura Ring 5, WHOOP 5.0, Apple Watch Series 10/11 and Ultra 3, Galaxy Watch 7/8, Pixel Watch 3/4 and every Garmin flagship since the Fenix 6 have no independent validation for any metric here.
- Small samples. The HRV study had 13 people (536 nights). Antwerp had 62 people, 1 night each.
- Mean bias is the wrong metric. A bias close to zero can mean that overestimates and underestimates canceled each other out. Look at the error and the limits of agreement.
- Everything is an estimate. None of them is a medical device (apart from the cleared features listed). The data should inform, not diagnose.
- Individual variation. Accuracy changes with skin tone, tattoos, BMI, fit on the wrist and type of activity. Most studies have predominantly white participants, a known gap.
- PSG isn’t perfect either. The sleep gold standard has an inter-rater agreement of about κ=0.75, meaning even human experts disagree about a quarter of the time.
- A failure they all share. Devices tend to classify wake, deep sleep and REM as light sleep, which inflates the total amount of light sleep.
Why This Accuracy Matters (my point as a doctor)
If you’re trying to understand how your sleep, your recovery or your energy respond to what you do, the accuracy of the data is the foundation of everything. When measurement error is high, the real patterns (between what you eat, how you train and how your body responds) get buried in the noise. When the measurement is good, you can see connections you’d never notice with the naked eye.
That’s exactly why, in practice, I don’t treat anyone based on their watch’s number alone. A wearable is a good signal of trends, not a test. For serious decisions about body composition and energy expenditure, we measure with the right methods (bioimpedance, calorimetry) and use the wearable as a complement, knowing where each one gets it right and where each one gets it wrong. Which is, at heart, what this whole post has given you: a map of where to trust each device.
Can You Use Several Devices Together?
You can, and many people do: a ring for sleep and a watch for training, for example, taking advantage of each one’s strengths. The challenge is getting the data to talk to each other, because each platform lives in its own box. But to start with, choosing ONE device that’s good at the metric you care about most already solves most of it.
Take care, and see you next time!
Responsible physician: Dr. Gilberto Nering Junior, CRM-SP 160822, RQE 142486 (Sports Medicine, Brazil). This text is for information only, is based on published studies, and does not replace an individual assessment.
Quick Questions
Which wearable is the most accurate for sleep?
It depends on the study and the population. In the Oura-funded study (Brigham, 2024, healthy adults), Oura led (κ=0.65). In the independent Antwerp study (2025, healthy), the Apple Watch led overall (κ=0.53) and the WHOOP led for deep sleep (69.6%). In the independent Korean study (2023, people with sleep complaints), the Fitbit Sense 2 led (κ=0.42). Fitbit is the most consistent across populations; Apple is the best in healthy adults.
Is Oura’s HRV really accurate?
The Oura Ring 4 had an agreement of 0.99 with an ECG strap in an independent study of 536 nights (Dial, 2025), the highest HRV accuracy among the devices tested. That’s overnight HRV; Oura’s daytime HR came in at 15% error in another test. The Oura Ring 5 hasn’t been validated yet.
Is WHOOP good for HRV?
The WHOOP 4.0 had a CCC of 0.94 and a MAPE of 8.17% for overnight HRV (Dial, 2025), a moderate rating. The 99.7% marketing number comes from a one-night study on the WHOOP 3.0 and doesn’t describe daytime accuracy, where the WHOOP 4.0 came in at 8.5% error.
Does skin tone affect accuracy?
It does. The optical sensor (PPG) is affected by skin pigmentation, and most studies have predominantly white participants, which is a known gap. The data may not hold equally for all skin tones.
Are wearable calories reliable?
Not precisely. In the Stanford study, calorie error ranged from 27% to 93%. The best published daily figure is Oura’s, at 13% error in real life; the Apple Watch is close to 28%. Treat all of it as a rough estimate, especially during intense exercise.
Why do different studies show different rankings?
Funding, sample size, population profile, firmware version, number of nights tested and PSG protocol all change the result. That’s why I combine several studies here and flag the funding source throughout.
References
- Robbins R, et al. (2024). Accuracy of Three Commercial Wearable Devices for Sleep Tracking in Healthy Adults. Sensors, 24(20), 6532. Funded by Oura Ring Inc.
- Schyvens AM, et al. (2025). Performance of six consumer sleep trackers in comparison with polysomnography in healthy adults. Sleep Advances, 6(2), zpaf021. Independent (VLAIO).
- Lee T, et al. (2023). Accuracy of 11 Wearable, Nearable, and Airable Consumer Sleep Trackers. JMIR mHealth and uHealth, 11, e50983. Independent; clinical sample.
- Herberger S, et al. (2025). Oura Ring Gen 3 in sleep-clinic patients. Scientific Reports, 15, 9461. Independent.
- Khan S, et al. (2025). Oura Ring sleep meta-analysis, 6 studies, N=388. OTO Open, 9, e70181. Independent.
- Dial MB, et al. (2025). Validation of nocturnal resting heart rate and heart rate variability in consumer wearables. Physiological Reports, 13(16), e70527.
- Gielen W, et al. (2026). Ten-device wrist heart rate validation. JMIR Formative Research, e85186. KU Leuven.
- Van Oost L, et al. (2025). Five consumer wearables versus 12-lead ECG. Sensors, 25(20), 6319.
- Kim J, et al. (2023). Apple Watch 7 and Galaxy Watch 4 versus 12-lead ECG. Annals of Rehabilitation Medicine.
- Shcherbina A, et al. (2017). Accuracy in wrist-worn, sensor-based measurements of heart rate and energy expenditure. Journal of Personalized Medicine, 7(2), 3.
- Choe J, Kang M (2025). Apple Watch accuracy meta-analysis, 56 studies. Physiological Measurement.
- Chevance G, et al. (2022). Accuracy and precision of energy expenditure, heart rate, and steps measured by Fitbit. JMIR mHealth and uHealth, 10(4), e35626.
- Kristiansson E, et al. (2023). Validation of Oura ring energy expenditure and steps. BMC Medical Research Methodology (with correction).
- Niela-Vilén H, et al. (2022). Oura ring versus ActiGraph in free living. CIN, 40(12), 856-862.
- Miwa M, et al. (2026). Apple Watch Series 6 and Fitbit Sense step counts over three weeks. PLOS ONE.
- Kim, et al. (2024). Apple Watch Series 6 free-living step count versus ActivPAL. Sensors.
- Rowe, et al. (2025). Apple Watch Series 5 step count at slow and shuffle walking speeds. PLOS ONE.
- de Leon, et al. (2026). Garmin Vivoactive 4 treadmill step count and heart rate. Applied Sciences, 16(3), 1286.
- Rider BC, et al. (2025). Four sports watches in laboratory and field. J Meas Phys Behav, 8(1).
- Cheung YS, et al. (2025). Validity of Fitbit Inspire 2 in step count. Physiotherapy Practice and Research, 46(2), 95-102.
- Parak J, et al. (2017). Energy expenditure estimation with a wrist device. JMIR mHealth and uHealth.
- Molina-García P, et al. (2022). INTERLIVE systematic review and meta-analysis, VO2 max. Sports Medicine, 52(7).
- Carrier B, et al. (2025). Aerobic capacity and pulse oximetry in wearable technology. Sensors, 25(1), 275.
- Carrier B, et al. (2023). Aerobic capacity and lactate threshold in wearable technology. Technologies, 11(3), 71.
- Engel FA, et al. (2026). VO2max from the Forerunner 245. European Journal of Applied Physiology, 126, 591-603.
- Caserman P, et al. (2024). VO2 max with Apple Watch Series 7. JMIR Biomedical Engineering, 9, e59459.
- Lambe R, et al. (2025). Accuracy of Apple Watch VO2 max. PLOS ONE, 20(5), e0323741.
- Apple Watch Series 10 VO2 max validation (2026). Mayo Clinic Proceedings: Digital Health.
- Freeberg KA, et al. (2019). Fitbit Charge 2 VO2max. mHealth, 5, 39. / Klepin K, et al. (2019). MSSE, 51(11), 2251-2256.
- Neudorfer, et al. (2025). Polar VO2 max versus cardiopulmonary exercise testing.
- Christakis, et al. (2025). Consumer-grade wearables in cardiovascular clinical care. npj Cardiovascular Health, 2, 82.
- Oura Internal Validation (2024). Temperature sensor validation. 16 participants, 93,571 data points.
- Maijala A, et al. (2019). Nocturnal finger skin temperature in menstrual cycle tracking. BMC Women’s Health, 19, 150.
- Lanfranchi, et al. (2024). Samsung Galaxy Watch SpO2 validation. Journal of Clinical Sleep Medicine.